Information Visualization for better understanding of cyber threats
In today's contribution, I would like to focus on data visualization within our ATOM ONE service. Data, information and security are a trend of modern times, and with the arrival of digitization, it is necessary to deal with the data flow, especially with regard to security. For this reason, in my opinion, it is necessary to concentrate on data movements and the search for anomalies in data transmissions. Generally, this topic is called Information Visualization or gaining visibility into the environment. Due to information visualization, it is possible to identify a potential attacker more easily, especially in the field of security, because during a new type of attack (new or modified TTP) it does not follow systematic, or even synthetic, procedures, and thus its detection by other systems can be rather difficult. One can interpret displayed plain information better opposing to data presented in rows or tables. That is exactly what we focused on during the development of our ATOM ONE service. Our goal was to interpret our experience and knowledge of information technologies into a visual form of information which I am going to present to you today. The most important thing is to simplify large amounts of data that flow into the environment, in general into any log management or SIEM. Data must be properly structured and targeted at a specific information consumer. Management requires very simplified data interpretation because of lack of time and sometimes of experience that could be invested in any analysis. That is why the central dashboard has been created in ATOM ONE, which clearly indicates the status of the environment, and where the weak and potentially vulnerable places can be expected.
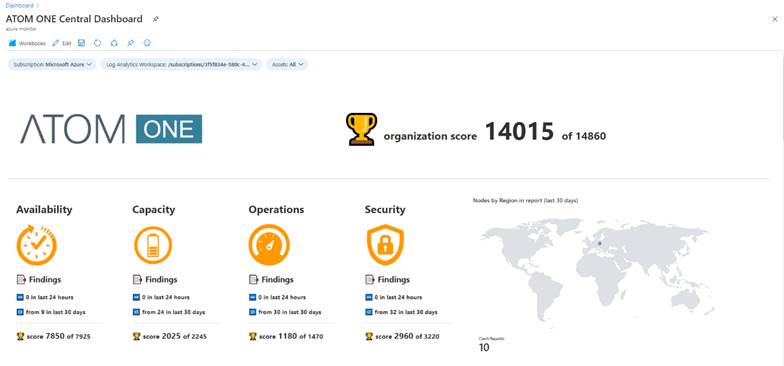
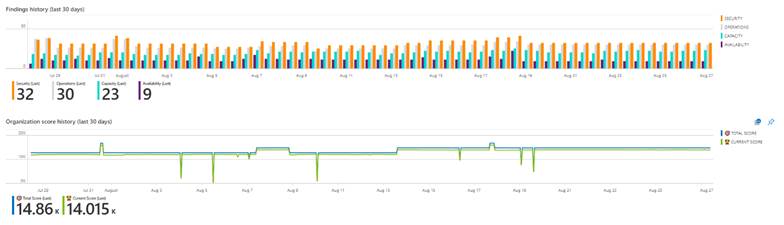
During the construction, we focused on 4 basic areas that are important to every manager if he is to have an overview of the state of the entrusted environment. These areas are Availability, Capacity, Operations and Security. In order to make it easier to understand the state of the environment, each of the findings has its own importance, and therefore also a value represented by a single number. So, we are able to easily determine whether we are doing poorly or well. In order to be able to monitor work of the teams internally, the organization should be constantly improving. Therefore, we also show the trend in the overview part of the performance of the Organizational Score (OS).
Some managers have moved into managerial positions just from the Operations and therefore are also interested in obtaining more detailed data reflecting the state of the environment.
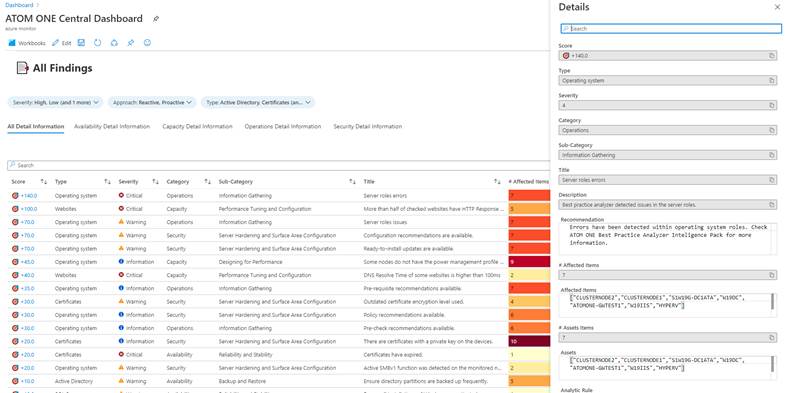
Also, in this case, there is a certain distrust of a single number (OS) in a product at first, so managers are glad to reconsider what the really serious problems the organization should address are. They often reflect this in their short-, medium- and long-term security goals. That is why the reports also contain detailed information about the findings and focus on grouping of problems. This makes it easier for the consumer to achieve a better protection as he can solve a single problem that has been found within the whole organization.
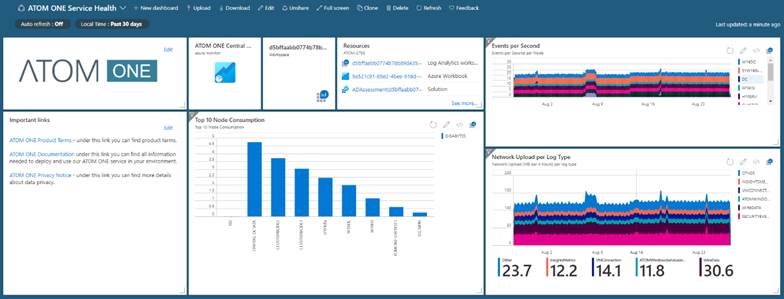
However, IT administrators need to receive information in greater detail to be able to solve a problem quickly, efficiently, and correctly, which is why they often use our prepared Dashboards and visualizations for Operations teams. The dashboard that gives us a complete overview of the state of the environment and problematic systems is available to the operating team.
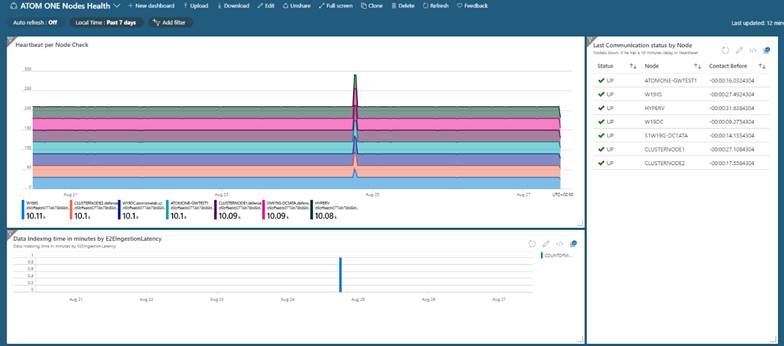
We can view information about the data flow, i.e. information about the amount of data our controlled devices send, the number of resources they use and what the total network transmission to our service amounts to.
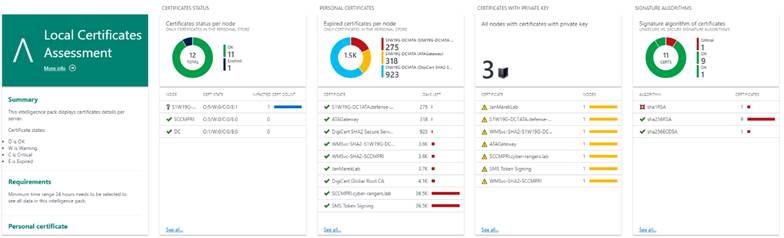
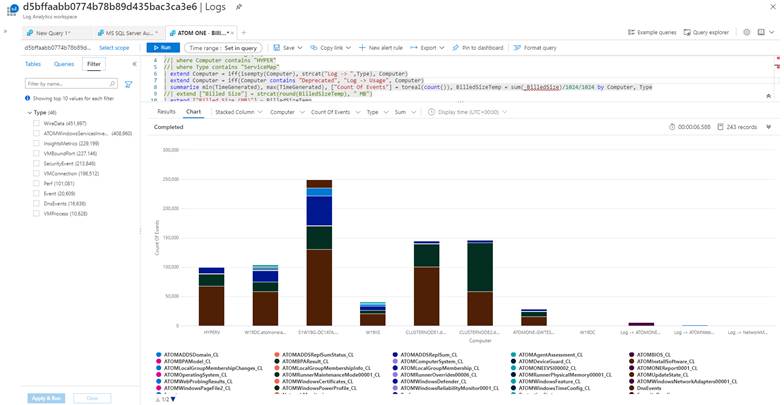
However, the list of visualizations does not end here. The hub of all events is the workspace, in which the administrator can view everything quickly and clearly. In one single place, we can find information about networks, domains, databases or operating systems, or we have the option to display internal connections of the network layer, where the processes of the Windows or Linux operating systems, which are monitored during the service, are also mapped to transactions.
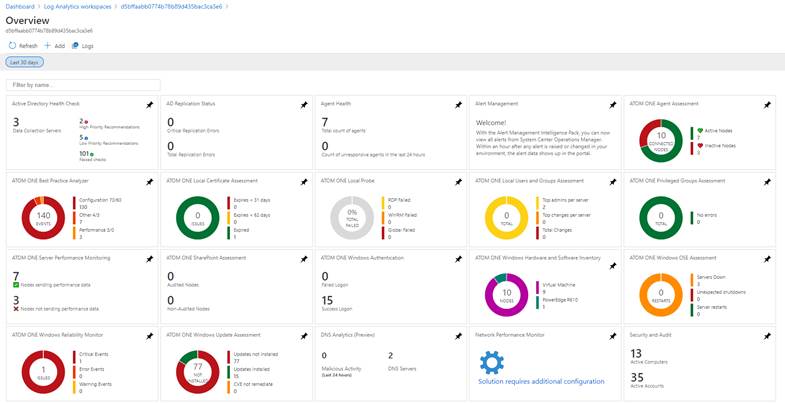
It is important that the provided data are comprehensible at first glance, because they are enhanced with icons that promptly inform if it is a case of a serious problem or just an informative message.
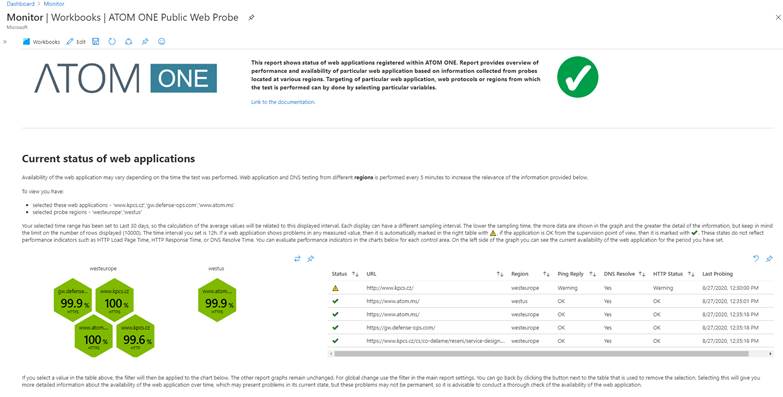
Most of these visualizations are moved to more complex and better filtered visualizations in the form of so-called Workbooks. These are comprehensive reports that display the status of the monitored area on a much larger scale. It takes into account the context not only of the service, but also of services related to it, such as in the case below, where the monitoring of website applications from the external environment is performed. I personally find the possibility of easy filtering in the content of the report very positive. If I notice "something" dubious in the environment, I can easily select an item and the whole report or part of it will be modified and targeted solely at the given subject.
If we subsequently want to immerse ourselves in detailed analytics and hunting for potential intruders, then we have the opportunity to move on to detailed information within the reports. Whenever it is important, all visualizations are routed to these reports. We can analyze the trends and look at the anomalies in behavior of the systems.
The ATOM ONE and Azure environments give administrators and security analysts a very powerful and open tool to gather a lot of information and a comprehensive view of the environment in a relatively short amount of time. Thanks to ATOM ONE, we can look at the state of the environment at a specific time without limiting the data base, and work with data in an analytical way so that we can predict the behavior of systems and services for which we are responsible and which we operate.
Share on social media